

The Baltic Labour Market Monitor: November 2026
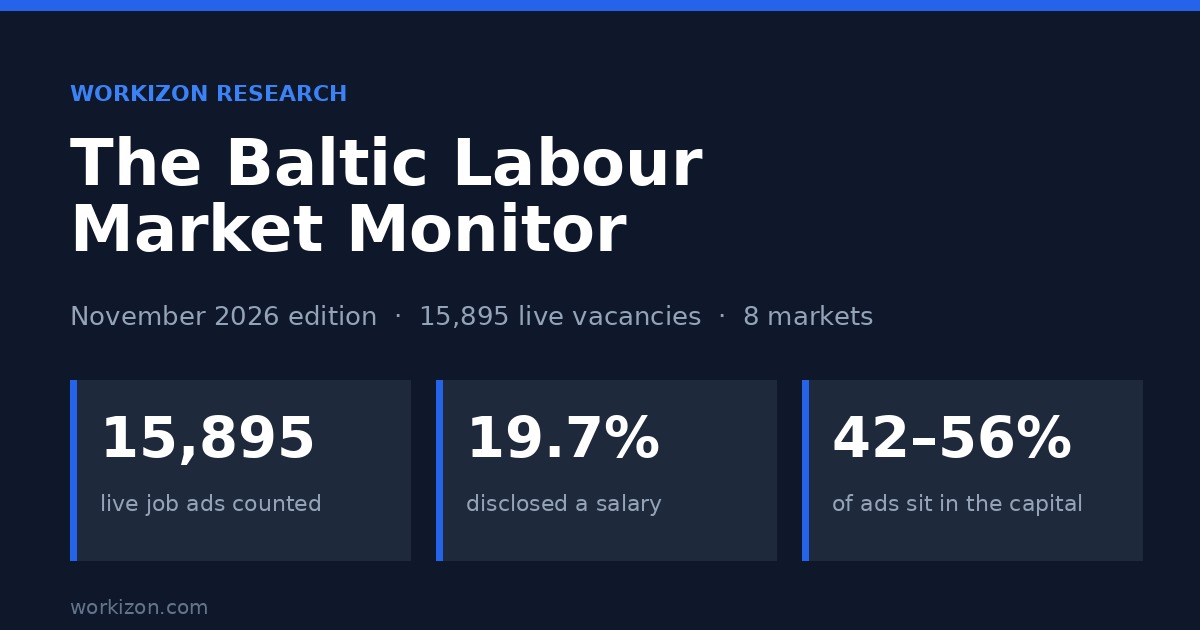
Every quarter we count the job ads that pass through Workizon and publish what the numbers say. This is the November 2026 edition: 15,895 live vacancies across eight markets, indexed between 25 September and 18 November 2026.
It is not a survey and it is not a forecast. It is a census of what employers were actually advertising, and it shows three things clearly: the Baltic labour market is concentrated in three capital cities, most employers still do not publish pay, and the few who do pay noticeably more than the market's middle.
Key findings
- Riga, Vilnius and Tallinn absorb between 42% and 56% of all vacancies in their countries. Outside the capitals, hiring thins out fast.
- Only 19.7% of all ads disclosed any salary — and almost all of those came from two sources: the Latvian State Employment Agency (NVA) and Reed.
- Among commercial job feeds, 0.2% of ads showed a pay figure (27 of 12,793). On the Latvian state portal, 100% did.
- The median advertised salary in Latvia was €1,490 gross per month (n = 2,584), with a quarter of ads below €1,132 and a quarter above €1,885.
- Pay varies more by occupation than by region: IT and logistics advertised around €2,000, cleaning around €780.
- Unemployment in the Baltic states sits at 6.2–8.0%, while job vacancy rates are only 1.6–2.3% — a market with people looking and roles staying open.
What we counted
The dataset covers Latvia, Lithuania, Estonia, Germany, Turkey, India, the United Kingdom and the United Arab Emirates. It combines public feeds from Careerjet, the Latvian State Employment Agency (NVA) and Reed, normalised into one schema and de-duplicated on title, employer and location.
| Market | Live ads | Share | Feeds |
|---|---|---|---|
| Latvia | 7,177 | 45.2% | Careerjet.lv, NVA |
| Estonia | 4,229 | 26.6% | Careerjet.ee |
| Lithuania | 3,575 | 22.5% | Careerjet.lt |
| United Arab Emirates | 224 | 1.4% | Careerjet.ae, Reed |
| Germany | 214 | 1.3% | Careerjet.de, Reed |
| Turkey | 198 | 1.2% | Careerjet.tr |
| India | 190 | 1.2% | Careerjet.in |
| United Kingdom | 88 | 0.6% | Reed |
The German, Turkish, Indian and UK feeds went live on 13–15 November 2026, so their counts reflect four days of coverage, not the size of those markets. The Baltic numbers cover the full period and are the only ones we treat as a complete market picture in this edition.
Finding 1: the Baltic job market is three cities
Where an ad carried a location, we geocoded it and grouped city districts into their parent city — Riga's Ķengarags, Purvciems and Imanta, for example, are counted as Riga.
| Market | Ads with a location | Largest city | Share of located ads | Second city |
|---|---|---|---|---|
| Latvia | 4,169 | Rīga — 2,280 | 54.7% | Jelgava — 130 |
| Lithuania | 3,440 | Vilnius — 1,919 | 55.8% | Kaunas — 684 (19.9%) |
| Estonia | 4,032 | Tallinn — 1,691 | 41.9% | Harju county — 292, Tartu — 241 |
| Turkey | 180 | İstanbul — 56 | 31.1% | Ankara — 13 |
| India | 148 | Bangalore — 38 | 25.7% | Hyderabad — 26 (17.6%) |
In Estonia the capital effect is wider than the city line: Tallinn plus the surrounding Harju county accounts for 49.2% of located ads. Tartu, the university city, adds 6.0%. Riga's share is the most extreme in the region — outside Riga, the next nine Latvian cities together account for less than 15% of located ads.
For anyone hiring outside a capital, that is the practical takeaway: the candidate pool you can reach with a local ad is small, and it competes with capital employers who can pay capital rates.
Finding 2: pay is still a secret — and the state is the exception
Of 15,895 ads, 3,129 (19.7%) included a salary figure. That headline number is misleading, because it is almost entirely the doing of two publishers.
| Feed | Ads | With salary | Disclosure rate |
|---|---|---|---|
| NVA (Latvia, state portal) | 2,975 | 2,975 | 100% |
| Reed (UK, DE, UAE) | 127 | 127 | 100% |
| Careerjet.de | 200 | 22 | 11.0% |
| Careerjet.ae | 199 | 4 | 2.0% |
| Careerjet.in | 190 | 1 | 0.5% |
| Careerjet.lv | 4,202 | 0 | 0% |
| Careerjet.ee | 4,229 | 0 | 0% |
| Careerjet.lt | 3,575 | 0 | 0% |
| Careerjet.tr | 198 | 0 | 0% |
Two readings follow. First, when a publisher requires or normalises a salary field, employers fill it: the Latvian state portal reaches 100%. Second, when the field is optional and unenforced, it stays empty: across the commercial feeds, 27 ads out of 12,793 carried a number — 0.2%.
This is the single cheapest fix available to the Baltic market. A job ad without pay does not disappear from the data; it disappears from the comparison, and candidates route around it.
Finding 3: what Latvia actually advertises
Latvia is the only market where enough ads carried a monthly figure to build a distribution: 2,584 ads, all from the state portal, all in euros, all gross.
| Percentile | Advertised monthly gross |
|---|---|
| 25th percentile | €1,132 |
| Median | €1,490 |
| 75th percentile | €1,885 |
| 90th percentile | €2,476 |
Split by occupation, the spread is wider than the regional spread:
| Occupation group | Median advertised monthly gross | Ads |
|---|---|---|
| IT & engineering | €2,015 | 70 |
| Logistics & driving | €1,950 | 298 |
| Finance & administration | €1,760 | 97 |
| Construction & trades | €1,540 | 76 |
| Education | €1,450 | 262 |
| Healthcare & social care | €1,211 | 243 |
| Cleaning & facility | €780 | 81 |
Logistics paying near IT rates is the surprise, and it holds up across the dataset: drivers, warehouse leads and freight dispatchers are the most advertised non-IT group in Latvia (12.8% of all Latvian ads) and one of the best paid. Education and healthcare, meanwhile, advertise below the national median — the opposite of what most wage surveys report for the public sector, and a reminder that advertised pay is not the same as total compensation.
Finding 4: the vacancy rate does not match the unemployment rate
Public baselines put the region in an odd place: unemployment is high enough to matter, but employers still report unfilled roles.
| Market | Unemployment, Sep 2026 (SA) | Job vacancy rate, Q4 2025 |
|---|---|---|
| Latvia | 7.3% | 2.2% |
| Estonia | 8.0% | 1.6% |
| Lithuania | 6.2% | 2.3% |
| Germany | 4.1% | 2.6% |
Sources: Eurostat une_rt_m (September 2026, seasonally adjusted, % of labour force) and jvs_q_nace2 (Q4 2025, % of jobs). Retrieved 18 November 2026.
Read together with the city data, the pattern is a matching problem rather than a demand problem: the roles are in the capitals, the available people are disproportionately outside them, and pay is often not shown, so neither side can price the move.
Method
We pull public job feeds into Workizon and keep a normalised record of every ad we see: title, employer, location, salary fields where the publisher provides them, and the date we first indexed it. For this edition we took all ads that were live on 18 November 2026 and had been indexed since 25 September 2026.
- De-duplication: removed on exact title + employer + location matches within a feed.
- Locations: city names normalised; districts and neighbourhoods rolled up into their parent city; county-level entries kept separate.
- Occupations: keyword rules over ad titles, applied only to the Latvian set where titles are in one language. About 46% of Latvian titles fell outside the rules and are excluded from the occupation table, not from the totals.
- Salary: only figures published in the ad, converted to monthly gross for comparison; no imputation, no estimates, no external salary benchmarks.
What this data cannot tell you
Honesty is part of the method, so:
- It is a census of advertised roles, not of employment. One employer hiring ten people for one role and one employer hiring one person look the same.
- Ad volume tracks feed coverage. The German, Turkish, Indian and UK numbers are four days old and cannot be compared with the Baltic totals.
- Salary medians cover only ads that published pay, and those are not a random sample — the Latvian state portal is over-represented, so the medians skew toward roles advertised through public employment services.
- Week-to-week changes in this edition reflect our crawl cadence more than hiring seasonality, which is why we do not publish a trend line yet. The first comparable quarter-over-quarter series starts in February 2027.
Cite this study
Workizon Research (2026). The Baltic Labour Market Monitor, November 2026: 15,895 live vacancies across eight markets. Workizon. https://workizon.com/blog/post/baltic-labour-market-monitor-november-2026
Journalists and researchers can request the aggregated dataset (market, city, occupation group, salary band; no personal data) through our contact page. We publish this monitor quarterly; the next edition is due in February 2027.
Looking for the roles behind these numbers? Browse jobs across Europe, part-time roles, or build a profile with the CV builder.
